2.1: The HTML Canvas API
- Download code
- 02-canvas.zip
- Live example
- examples/02-canvas/index.html
Back in the early days of the web, you’d occasionally see sites that created images using thousands of 1x1-pixel div or span elements, with each element assigned a different background-color to simulate individual pixels.
Fortunately, modern browsers support an HTML element called canvas, standardized in 2006, which gives us a much finer degree of control when it comes to drawing lines, shapes and images in browser-based web applications. In this module, we’ll add a canvas element to our application, along with some simple JavaScript code that’ll demonstrate how to render graphics onto our canvas.
Open index.html and update the body element so it looks like this:
<body>
  <canvas id="my-canvas" width="400" height="300"></canvas>
  <script type="module" src="./main.js"></script>
</body>
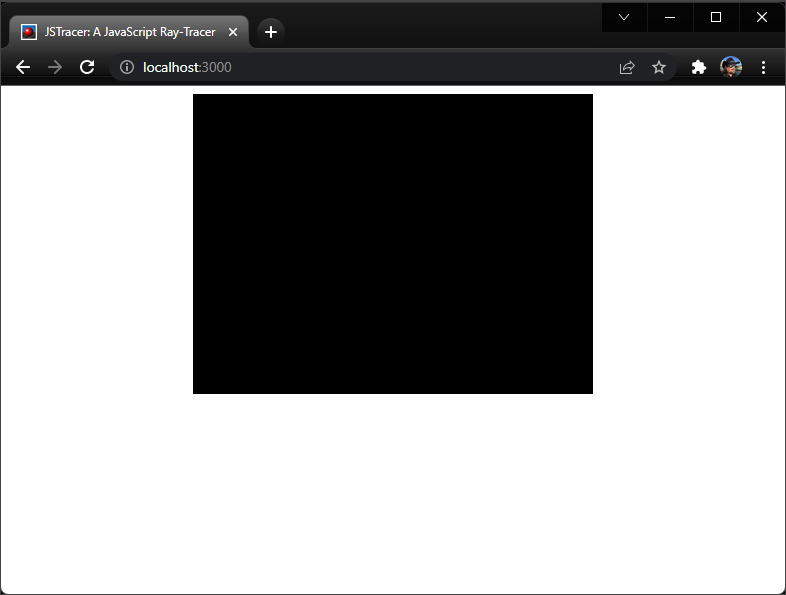
Next, add a CSS rule to style.css that sets the canvas’ background color to black:
canvas {
  background-color: #000;
}
You should now see a blank page with an empty black canvas on it:
Drawing graphics onto a canvas
Now we’re going to add some JavaScript code to demonstrate how to draw graphics onto the canvas.
Open main.js, delete the existing code, and replace it with this:
let myCanvas = document.getElementById('my-canvas')
let ctx = myCanvas.getContext('2d');
ctx.fillStyle = '#C14634';
ctx.fillRect(40, 40, 170, 210);
If you’re using vite, the page will reload automatically. If you’re using Spark, you’ll need to refresh your browser. You should see this:

To draw more complex shapes, we can just call fillRect over and over again:
let myCanvas = document.getElementById('my-canvas')
let ctx = myCanvas.getContext('2d');
ctx.fillStyle = 'rgb(3,4,5)';
ctx.fillRect(0, 0, 400, 300);
ctx.fillStyle = '#dfd9dc';
ctx.fillRect(0, 0, 100, 30);
ctx.fillRect(110, 0, 100, 30);
ctx.fillRect(0, 40, 30, 100);
ctx.fillRect(0, 150, 30, 100);
ctx.fillRect(220, 150, 50, 100);
ctx.fillRect(100, 260, 110, 100);
ctx.fillRect(220, 260, 110, 100);
ctx.fillRect(340, 0, 60, 140);
ctx.fillStyle = '#C14634';
ctx.fillRect(40, 40, 170, 210);
ctx.fillRect(340, 260, 170, 210);
ctx.fillStyle = '#E2C158';
ctx.fillRect(220, 0, 110, 30);
ctx.fillRect(220, 40, 110, 100);
ctx.fillStyle = '#224170';
ctx.fillRect(0, 260, 90, 40);
ctx.fillRect(280, 150, 120, 100);
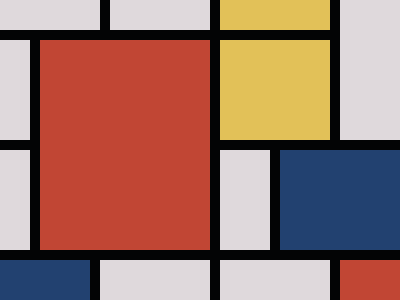
Try it live: examples/02-canvas/mondrian.html
There we go… we’re using JavaScript and the <canvas> element to create digital artworks inspired by Piet Mondrian. Not bad.
In this example, we’ve introduced four new concepts:
- We get a reference to the canvas using
document.getElementByIdand specifying theidof ourcanvaselement - We create a graphics context by calling
myCanvas.getContext('2d'). The'2d'here specifies we’re using a 2-dimensional canvas; some browsers now support built-in 3D graphics using the WebGL API, but in this workshop we’ll be rendering 3D graphics onto a 2D canvas. - We’re setting the context’s fill style by specifying a color. Canvas graphics support all HTML color formats, including hex digits (
#123abc), RGB valuesrgb(0,127,255), and alpha transparencyrgba(63,127,255,0.5). - We’re calling
ctx.fillRect(top, left, width, height)to draw a filled rectangle using the current fill style.
Procedural graphics
Drawing individual rectangles by hand is kinda cool, but things don’t get really exciting until we start using JS code to calculate the colors of the pixels we’re drawing. One of the simplest procedural patterns is a chessboard pattern.
Here’s the getColorAtPixel function for drawing a chessboard pattern. Based on the tile size, we work out whether this pixel is in an odd-numbered or an even-numbered row and column:
(x, y) => {
    const xOdd = (x % (2 * size) < size);
    const yOdd = (y % (2 * size) < size);
    return (xOdd != yOdd ? color1 : color2);
}

Try it live: examples/02-canvas/index.html#chessboard
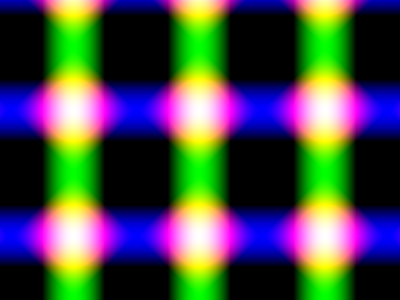
We can also calculate individual red, green, and blue pixel values based on the x/y coordinates passed into the function.
(x, y) => {
  let r = (4 * x) % 256
  let g = (x + y) % 256
  let b = y % 256
  return `rgb(${r},${b},${g})`
}
You should get an image something like this:
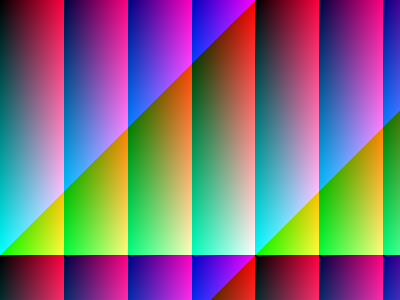
Try it live: examples/02-canvas/index.html#gradiance
Exercise: Procedural Patterns
Download the code for this section from examples/02-canvas.zip
Add a new pattern to modules/patterns.js:
-
Add a new
export function MyPatterntomodules/patterns.js, -
Come up with a new method for translating the
x,ycoordinates intor,g,bcolor values - there’s some suggestions below -
Add a new
caseto theswitchstatement inmain.js:case "#mypattern": Patterns.MyPattern(myCanvas); break; -
View your pattern by going to
index.html#mypattern
Here’s a couple of fun things to try:
- The modulus operator in JavaScript is
%, so an expression likex % 256will always give you a value between 0 and 255 - useful for constructing valid RGB colors where each of the red, green, and blue values has be between 0 and 255. - You can also write
256as0xff, which might look more natural if you’re used to HTML hex color values. Math.abs(x)will give you the absolute value (i.e. always positive) ofx- The trigonometry functions
Math.sin(x)andMath.cos(x)will give you a value between -1 and +1; try multiplying this by thexoryvalues
Here’s a few more examples:
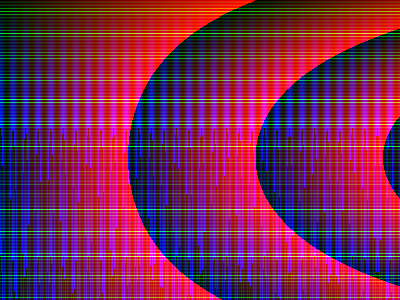
Supernova
Try it live: examples/02-canvas/index.html#supernova
(x, y) => {
  let r = (x * (1 + Math.sin(y / 100))) % 255 // 4*x % 255;
  let g = Math.abs(20 * Math.tan(y)) % 255
  let b = (y * (1 + Math.cos(x / 2))) % 255 // (x+y) % 255;
  return `rgb(${r},${g},${b})`
}
Lasers
Try it live: examples/02-canvas/index.html#lasers
(x, y) => {
  let r = 255 * Math.sin(200 - x / 20) + 255 * Math.cos(150 - y / 20)
  let g = 255 * Math.sin(200 - x / 20)
  let b = 255 * Math.cos(150 - y / 20)
  return `rgb(${r},${g},${b})`
}
The HTML Canvas: Review & Recap
- The
canvaselement and API give us a way to draw graphics using JavaScript - To draw graphics, we need to get a graphics context for our canvas element.
- We control the color we’re drawing by setting the context’s
fillStyleto an HTML color value. - We can draw individual pixels by using the
fillRectmethod and specifying a width and height of ` pixel.
References and Further Reading
- The Canvas API: https://developer.mozilla.org/en-US/docs/Web/API/Canvas_API
- HTML Colors reference at w3schools: https://www.w3schools.com/html/html_colors.asp
- Download code
- 02-canvas.zip
- Live example
- examples/02-canvas/index.html